Virtual Reality and 3D Business Intelligence
Data viz 101 says that data visualisations are almost always better in 2 dimensions. In 3D:
- Perspective angles make it more difficult to compare like with like. Length comparisons have greater error.
- Objects overlap; closer objects can obscure further away objects.
Switching from 2d to 3d doesn't increase the screen area and 2d + contour is almost always a cleaner way of representing data. 3d is generally reserved for objects that are 3d in-real life, or exceptions where the perspective is fixed. Yet, 3d is our natural environment - our eyes and ears have evolved to live in 3d. Surely there is something we can use it for to improve general information display?
Holographics
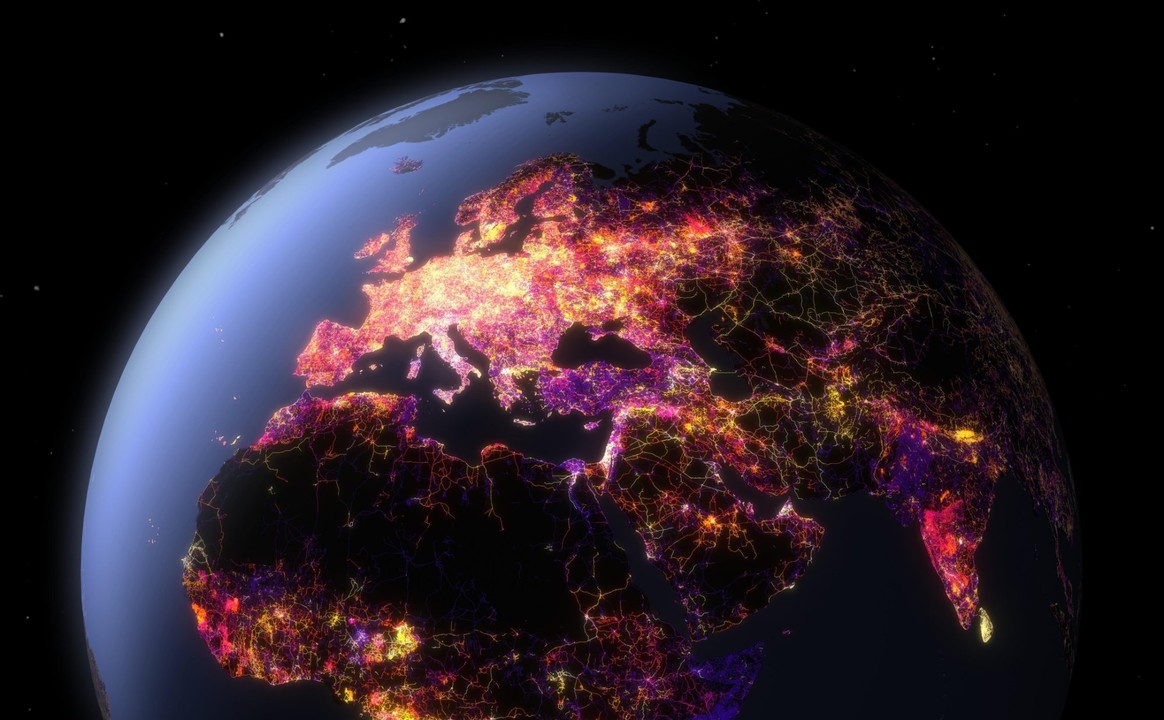
Here I am at the Musion Holographic studios. We trialled a number of different data visualisation designs on their screen (above is 'Peoplemovin', by Carlo Zapponi).
Musion have a business model that can be broken into two categories:
- Holographic People
- Exploding Engine Parts
They've pretty much nailed all the highest profile clients you can imagine in Holographic people (telepresence) - you might have seen them when they brought rapper Tupac back from the dead at the Coachella festival, or the MTV awards, and they staged over 3500 simultaneous holographic projections across India, of the presidential candidate Narendra Modi, for the Indian general election. They've done the same with product display - Take a physical blue chip client product, explode it into different parts and turn it into a hologram.
But they don't do any launches for data companies. Surely there are some analytics firms out there wanting to make a big splash with their data products? The barrier is conceptual. Most people don't yet think of numerical data in anything other than the charts they saw in school. What is good data viz in 3d? Can we imagine it?
Bridging the Gap
The Musion screen is not a real hologram. It's based on an old magicians trick, with a 45 degree screen and some unusual refractive properties. They add to the illusion of depth with motion and rotation.
We built a skeleton 3d filter graph some years ago mainly to allow us to find our single female friends really quickly...

It is running for desktop here (caveats: the facebook api has been tightened and we no longer autoload images, 2 - it's performant on mobile, but not formatted so best viewed on desktop... 3 - open to instagram requests :). You can play with controls in the top right. Nothing really came of it. But the stuff that we personally instinctively like are the zoom rotations.
In the real world, our 3d input varies as our eyes move. When cats hunt prey they move their heads from side to side to gain a better idea of distance. We're the same. Here are two conjectures:
1) 3D Data visualisation becomes useful when we design information rich transitions and rotations
2) 3D Data visualisation becomes useful when it becomes responsive to the location of our eyes and ears.
Unresponsive 3d on a flat screen is not enough. It has to include motion, and to be responsive to us...to be immersive.
Virtual Reality opens the gateway to 3d BI
2016 promises to be the year of virtual reality. One can think of a couple of obvious advantages of VR for BI/data visualisation.
- 360 degree view.
- Cheaper than an 8 screen display
- Immersion means the avoidance of external distraction, and resultant improved focus.
If the above conjectures are true, those won't be the real drivers of whether one can successfully build an improved data visualization system in a VR environment. Rather
- Is the link between head movement and visuals usefully used for data display?
- Is the utilisation of sound correctly harnessed for data alerts. Sound is the alert sense, and is intrinsically linked to location - a fact which has been lost in the current internet. Our most basic evolution harnesses sound to alert us first to a position, which we follow up with visual focus. Can we recreate that in our new immersive world of data?
***Update; We'll be discussing all this at Visual Intelligence, In London, on the 25th November - a pretty amazing lineup of practitioners, founders, corporates and investors: ***
Food for thought. I want to be able to swivel a graph and fly along it, like a roller coaster. I leave you with the Zurich chamber orchestra...
Guiding industry on the adoption of VR & AR for training, work instructions and more. Director at Eirmersive.
7yIf you're ever back in Dublin at the same time as one of our 3Dcamp Dublin VR events is on Finn we've love you to present on this.